Arivis Pro (Zeiss)
Arivis
Introduction
Arivis Pro is your modular software for multi-channel 2D, 3D and 4D images of almost unlimited size, highly scalable and independent of local system resources. The software alllows you to dynamically interact with and visualize large datasets (eg: >1TB). For quantification of large datasets including 3D and 4D data, the Arivis pipelines offer robust and easy solution for processing and quantifying multidimensional microscopy data. The pipeline can be built by combining various operators for denoising, segmentation, filtering and other analysis tasks in a structured pipeline with an interactive preview. Arivis provides a variety of built-in pipelines for segmentation, colocalisation, spot detection and so on. The software also provides a robust option to integrate python scripts to your pipeline in Arivis. It also support training a machine learning model using the annotations that can be created on the Apeer platform (directly embedded within the software). The DL models like Stardist and Cellpose can also directly be integrated to the pipelines. Retraining of these models cannot be done within the software, should be done outside the software and then have to be integrated to the pipeline here.
Tip: Arivis is installed in LIPS8 and LIPS11. You can access it directly or via remote connection
Step-by-step
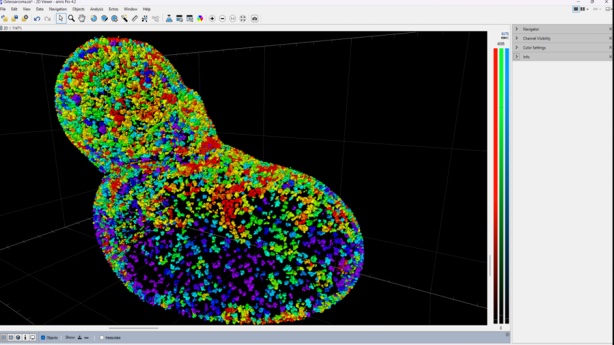
The example data is a 3D image z stack of the bone region in the skull acquired with Confocal microscope.
Step 1: Import a new image
- Open Arivis Pro
- Select: File > Import ( this is to convert any usual image format to the specific format of Arivis(sis format))
- Destination folder and the source folder/file is mentioned in the dialogue box that opens up
Tip: Import function is faster when the images are stored locally (best option is to copy it from the fileserver to the local drive
Step 2: Manipulating the image
- Once the image is opened, different view options(at the bottom of the viewer) can be used to view as planes or 3d (volumetric/max intensity)
- The right side panel has a navigator to move through planes and timepoints; it also have image information(no of channels/timepoints, dimensions,e.t.c), along wit histograms and clipping options for your image
Step 3: Analysis
Tip: Before starting the analysis, make sure the environment is set properly. Extras > Preferences > ‘built in python’ is the default. In case you are using cellpose or any other DL model, make sure you already have the environment created and the packages installed within it and set it as the anaconda env option here in that case
- Select: Analysis > Analysis panel and then when the analysis panel opens up in the left side panel, select: Import > your pipeline (when you click at the the menu option at the top right of the analysis panel))
- Run the analysis pipeline all at once by clicking the play button or one step after other by using the arrows
Step 4: Quantifications
- Once the objects are created after analysis, the objects table can be displayed by: Menu > Objects> Objects table, desired features sucha s volume, area, sphericity, etc can be selected here
Alternatives
Cellpose environment for Arivis
- Make sure Anaconda is already installed in the system
- Keep the environment.yml file (it has already all the packages that are required for the cellpose and Arivis) is in the c drive at Users/lmfuser/
- Then go to anaconda powershell prompt (terminal)
- Type ‘conda env create environment.yml’ press enter :it should download all the packages then
- Once done, go to anaconda navigator, in the environments section, select import and then in the new dialogue box with the option import from local drive: add the path of environment.yml file and give a name for the environment (eg: cellpose_new) & press import
- Go to Arivis, extras -> preferences -> scripting -> anaconda environment: select the newly created environment and then press install Arivis package (if you want, you can also test the package)
- Import the pipeline on the Arivis window, and it should work!